North American Suppliers Struggling to Meet Demand – GEP

The GEP Global Supply Chain Volatility Index is a guide for procurement, purchasing and supply chain professionals around the world about the ongoing conditions, shortages, transportation costs, inventories and backlogs based on a monthly survey of 27,000 businesses.
The latest data considered in the April 2024 report indicates transportation costs and stockpiling fell because of decreasing container rates, while demand at Asian factories is at its strongest rate in two years.

“In March, orders placed with Asia’s suppliers ramped up, which is a strong signal of accelerating growth in manufacturing in the coming months,” explains Roopa Makhija, Co-Founder and President at GEP.
“In North America, suppliers are reporting difficulties meeting orders due to staff shortages, signalling capacity constraints, even though input demand declined slightly. This does mean that manufacturers have strong pipelines which undermines the Fed’s expressed desire to cut interest rates, at least in the near-term."
Key insights from GEP Global Supply Chain Volatility Index
- North American suppliers struggled to meet orders due to a lack of staff
- Manufacturing recession in Europe eased in March, but steep downturn in Germany remained a major drag on the continent
- Despite Red Sea and Panama Canal disruptions, transportation costs and stockpiling fell in March because of decreasing container rates
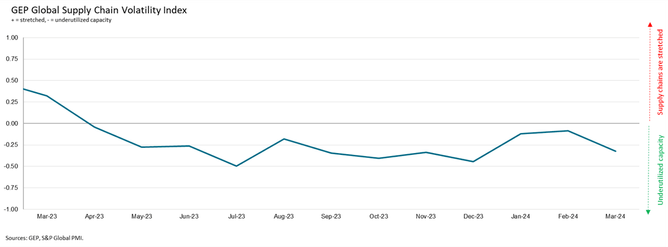
The index fell for the first time this year to -0.32 in March, compared to February’s 10-month high of -0.08.
While this signals a pickup in the level of spare capacity at global suppliers, underlying data suggests this was due to global manufacturers using up their surplus inventory. Some of this was accumulated because of disruptions in the Red Sea and Panama Canal, as well as cutting back on stockpiling as companies show a preference to clear holding stocks before going back to their vendors with bumper orders.
Demand for raw materials, commodities and components once again showed signs of recovering, carrying on with the year-to-date trend. Asia was the primary driver of this improvement, led by India and China, with factories across the region boosting their purchases of inputs by the strongest degree since December 2021.
Global transportation costs fell to their lowest level since last December as the diminishing impact of the Suez Canal disruption led container rates to decline. The data shows no discernible impact to the world’s supplies from either the Red Sea attacks or from reduced capacity on the Panama Canal, as businesses adjusted to longer delivery schedules.
Key Findings GEP Global Supply Chain Volatility Index
DEMAND: Raw materials, commodities and components moved closer to the long-term average in March, showing recovery in the global manufacturing industry. Asia saw purchasing activity across the region rising at its strongest pace in over two years, acting as the primary driver of this positive trend.
INVENTORIES: Disruption from the Red Sea saw more businesses cutting down on their surplus inventories. Reports of safety stockpiling were at their lowest since November 2019 - before the pandemic.
MATERIAL SHORTAGES: Reports of item shortages remained among the lowest seen in four years.
LABOUR SHORTAGES: Evidence of staffing capacity constraints continued, particularly in Europe and North America. Global reports of rising backlogs because of labour shortages hit their highest since last August.
TRANSPORTATION: Another impact from the Red Sea, as global transport costs fell to their lowest in the year to date, as supply chain disruption receded.
German manufacturing weighs heavy on Europe
NORTH AMERICA: Index fell to -0.31, from 0.17, signalling a renewed increase in spare capacity following the uptick in pressure in February. This reflected a reduction in inventories, alleviating some strain on the region’s vendors.
EUROPE: Index fell to -0.62, from -0.41. Albeit down on the month, the index is much higher than it was at the end of 2023. Still, recession in Germany’s manufacturing economy is weighing on the continent.
UK: Index rose further in March to -0.17, from -0.34, its highest level in a year and signalling a shrinking amount of spare capacity across the UK's supply chains.
ASIA: Index little-changed at -0.07, down only narrowly from -0.02. Overall, the index points to Asian suppliers operating at close to full capacity as regional input demand grew at the fastest pace for over two years.

How does the index work?
The GEP Global Supply Chain Volatility Index is produced by S&P Global and GEP. It is derived from S&P Global’s PMI surveys and sent to 27,000 global companies.
The headline figure is a weighted sum of six sub-indices derived from PMI data, PMI Comments Trackers and PMI Commodity Price & Supply Indicators compiled by S&P Global.
A value above 0 indicates that supply chain capacity is being stretched and supply chain volatility is increasing. The further above 0, the greater the extent to which capacity is being stretched.
A value below 0 indicates that supply chain capacity is being underutilised, reducing supply chain volatility. The further below 0, the greater the extent to which capacity is being underutilised.
The index is published once a month and you can review the March survey here.
******
Check out the latest edition of Supply Chain Magazine and sign up to our global conference series – Procurement and SupplyChain LIVE 2024.
******
Supply Chain Digital is a BizClik brand.
- How Gebrüder Weiss is Modernising its Logistics FacilitiesLogistics
- Supplier Collaboration Key to Johnson & Johnson Climate PushSustainability
- How the C3 AI Supply Chain Suite Drives Increased ResilienceTechnology
- The Art of Supply Chain Planning with Gartner, SAP, KinaxisSupply Chain Risk Management


