Top 10: Ports
Written By John Shimkus
10. Rotterdam, Netherlands
2010 TEU: 11.100
Growth 2009-2010: 14%
Serving as the largest port in Europe, the Port of Rotterdam in the Netherlands covers an area of 105 square kilometers. It has been in existence since the 14th century and was the world’s busiest from 1962 through 2004, until large Chinese ports overtook the rank.
9. Dubai, United Arab Emirates
2010 TEU: 11.600
Growth 2009-2010: 4%
Owned and operated by DP World, one of the largest maritime terminal operators in the world, with over 49 terminals in 31 countries. Dubai has several ports, but the two major ones include the man-made Port Rashid, and Jebel Ali Port, the world’s largest man-made harbor and the biggest port in the Middle East.
8. Qingdao, China
2010 TEU: 12.012
Growth 2009-2010: 17%
Known in particular as the largest inbound port for iron ore, the Port of Qingdao was established in 1892, and is China’s largest crude oil port. Situated on the Yellow Sea, the port boasts ideal conditions, such as deep and wide waterways, and is free from ice and silt year-round.
7. Guangzhou, China
2010 TEU: 12.550
Growth 2009-2010: 12%
Operated by state-owned Guangzhou Port Group Co. Ltd, the port is South China’s largest. Dating back to the Qin Dynasty, the port was considered the “Silk Road of the Sea,” and is now considered the economic and transportation center for the Pearl River Delta region.
6. Ningbo, China
2010 TEU: 13.144
Growth 2009-2010: 25%
Located at the center of the North-South China shipping route and serving the Yangtze River. Established in 738 during the Tang Dynasty, it was established as one of five treaty ports following the Opium War. However, increased shipping activity has led to excessively polluted water in Ningbo.
5. Busan, South Korea
2010 TEU: 14.180
Growth 2009-2010: 19%
The Port of Busan Serves as the largest port in Northeast Asia. It has incorporated new technologies, such as the U-Port system and streamlined screening, to maintain competitive edge. The port is deep enough to accommodate more than 10,000 TEU container vessels. It is also in active exchange with 500 ports in 100 countries.
4. Shenzhen, China
2010 TEU: 22.510
Growth 2009-2010: 23%
One of the busiest and fastest growing ports in mainland China, the Port of Shenzhen serves as the point of trade between Hong Kong and the mainland. Over 30 billion Yuan has been invested in the port since 1979 to construct the complex infrastructure. On a monthly basis, over 560 ships call at the port.
3. Hong Kong, China
2010 TEU: 23.530
Growth 2009-2010: 12%
Deep waters and natural shelter make the Port of Hong Kong ideal for containerized shipping. The port is vital, handling 89 percent of Hong Kong’s total cargo throughput. The port was ceded by the United Kingdom in 1898 after the Opium War, but has been returned to China as of 1997.
2. Singapore
2010 TEU: 28.400
Growth 2009-2010: 10%
Established in 1996, the Port of Singapore has since become a global hub port and international maritime center. The Maritime and Port Authority of Singapore is the driving force behind port operations and is responsible for regulating port activities. On average, the Port of Singapore attracts 140,000 vessel calls annually. Two to three ships arrive or leave Singapore every minute.
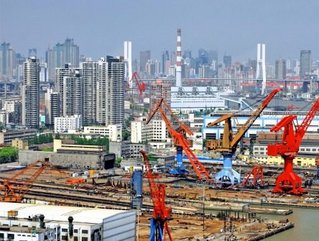
1. Shanghai, China
2010 TEU: 29.069
Growth 2009-2010: 16%
The Port of Shanghai comprises both a deep-sea port as well as a river port, serving the Yangtze, Huangpu, and Qiantang rivers. According to the Shanghai International Port Group (SIPG), which operates all public terminals at the port, annual import and export trade through Shanghai accounts for a quarter of China’s total foreign trade.
Shanghai expanded as a port city following its designation as an international treaty port in 1842. However, the communist takeover in 1949 cut overseas trade dramatically, and port activity decreased. In 1991, China’s central government permitted economic reform in Shanghai, and port activity has flourished since.
Over 2,000 container ships depart the port every month. Features include: 125 berths with a total quay length of about 20 kilometers; 293 thousand square meters of warehouses; over 4.7 million square meters of storage yards; and 5,143 units of cargo-handling equipment.